Ripple Price Prediction – February 13
The Ripple price is currently down by 2.68% in the last 24 hours; the current market value is likely to cross below the 9-day moving average.
XRP/USD Market
Key Levels:
Resistance levels: $1.00, $1.05, $1.10
Support levels: $0.65, $0.60, $0.55
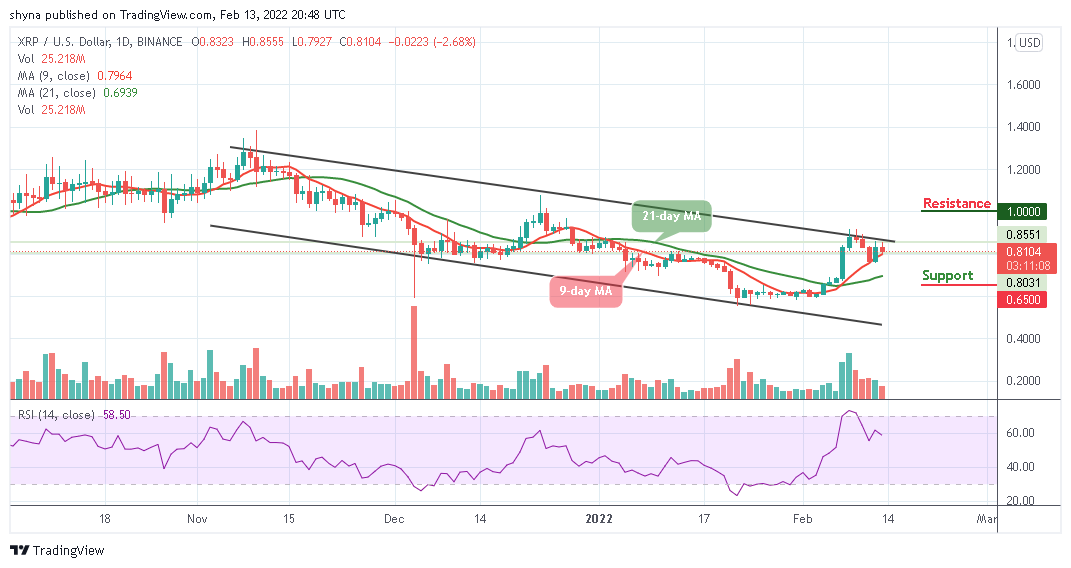
XRP/USD is currently facing a bearish move, and it is likely for the coin to cross below the 9-day moving average facing another support at $0.70. Meanwhile, a bearish breakdown below the 21-day moving average could give the market enough strength to dig deeper, but the rise could lead the Ripple market into a bullish scenario.
Ripple Price Prediction: What is the Next Direction for XRP??
According to the daily chart, the Ripple price keeps moving within a descending channel to cross below the 9-day and 21-day moving averages. However, technically, the channel formation is a bearish flag pattern that mostly followed a break-down in price. Therefore, following the past few days of price actions, XRP/USD is consolidating around the upper boundary of the channel. Currently, the Ripple price is bearish, but a bounce-back above the channel may locate the resistance levels at $1.00, $1.05, and $1.15.
Moreover, a price breakdown towards the lower boundary of the channel may occur as bears may find new lows at $0.65, $0.60, and $0.55 support levels. More so, from a long-term perspective, the Ripple (XRP) is still in a dominant bearish bias as the technical indicator Relative Strength Index (14) is heading below 60-level, preparing for another support. Furthermore, if the Ripple price begins to oscillate downward, it may likely create a new low around the $0.70 support level.

Against Bitcoin, the Ripple (XRP) remains above the 9-day and 21-day moving averages. Meanwhile, the sellers are trying to push the price below the channel and the bearish continuation could bring it to the support level of 1700 SAT and below.
However, if the Ripple bulls can regroup and push the market above the upper boundary of the channel, a possible rise could take the market to the resistance levels of 2200 SAT and above. According to the technical indicator Relative Strength Index (14), the signal line is likely to cross below 60-level, suggesting that more bearish signals may play out.
Looking to buy or trade Ripple (XRP) now? Invest at eToro!
68% of retail investor accounts lose money when trading CFDs with this provider
Source link

GIPHY App Key not set. Please check settings