Bitcoin gained pace above the $42,000 resistance zone against the US Dollar. BTC is now surging and might even surpass the $45,000 resistance zone in the near term.
- Bitcoin started a strong increase above the $42,000 resistance zone.
- The price is trading well above $42,000 and the 100 hourly simple moving average.
- There is a connecting bullish trend line forming with support near $43,500 on the hourly chart of the BTC/USD pair (data feed from Kraken).
- The pair could continue to rise if it clears the $44,500 resistance zone in the near term.
Bitcoin Price Rallies 5%
Bitcoin price gained bullish momentum after there was a close above the $40,000 level. BTC even cleared the $42,000 resistance zone to move further into a positive zone.
The recent upward move gained pace above the $43,000 level. Finally, the price spiked above the $44,000 level and settled above the 100 hourly simple moving average. A high is formed near $44,528 and the price is now consolidating gains.
It is trading above the 23.6% Fib retracement level of the recent increase from the $41,141 swing low to $44,528 high. There is also a connecting bullish trend line forming with support near $43,500 on the hourly chart of the BTC/USD pair.
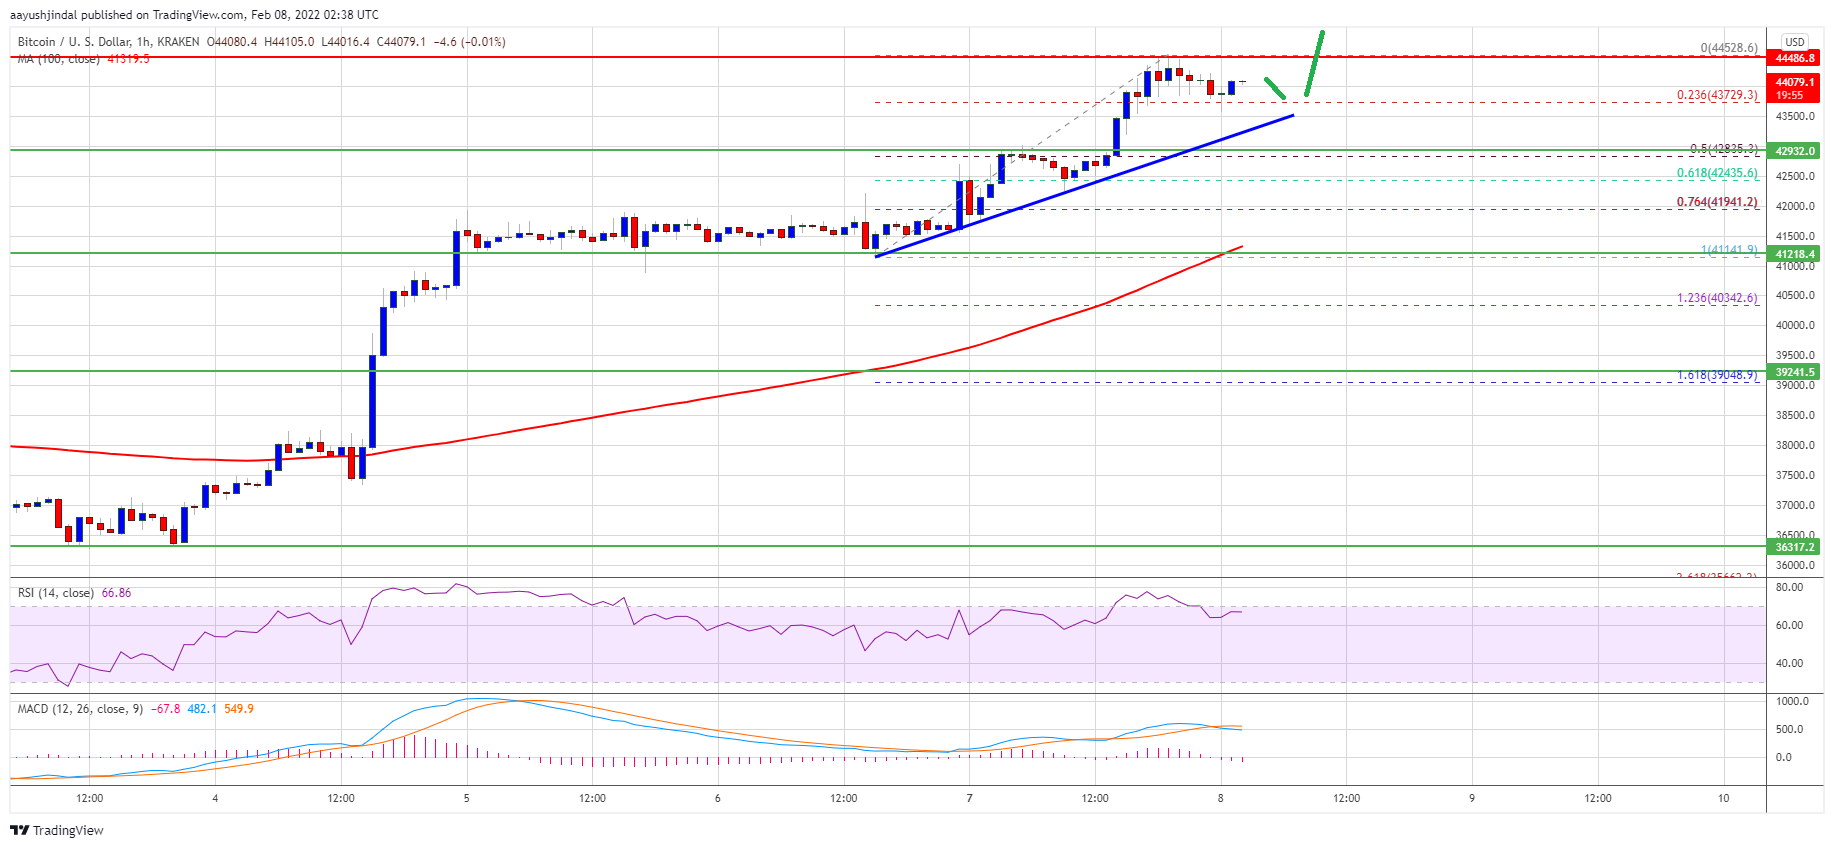
Source: BTCUSD on TradingView.com
On the upside, an immediate resistance is near the $44,500 level. The next major resistance is near the $45,000 zone. A clear upside break above the $45,000 resistance level could spark additional gain. In the stated case, the price could even rise towards the $46,500 resistance zone.
Dips Supported in BTC?
If bitcoin fails to start a fresh increase above $44,500, it could start a downside correction. An immediate support on the downside is near the $43,750 zone and the trend line. The first major support is seen near the $43,000 zone.
It is near the 50% Fib retracement level of the recent increase from the $41,141 swing low to $44,528 high. If there is a downside break below the $43,000 support, the price could slide towards the $41,200 support and the 100 hourly simple moving average.
Technical indicators:
Hourly MACD – The MACD is now gaining momentum in the bullish zone.
Hourly RSI (Relative Strength Index) – The RSI for BTC/USD is now above the 60 level.
Major Support Levels – $43,500, followed by $43,000.
Major Resistance Levels – $44,500, $45,000 and $46,500.
Source link

GIPHY App Key not set. Please check settings