Litecoin Price Prediction – February 11
The Litecoin price prediction moves to cross below the 9-day moving average following the current bearish action in the market.
LTC/USD Market
Key Levels:
Resistance levels: $170, $180, $190
Support levels: $100, $90, $80
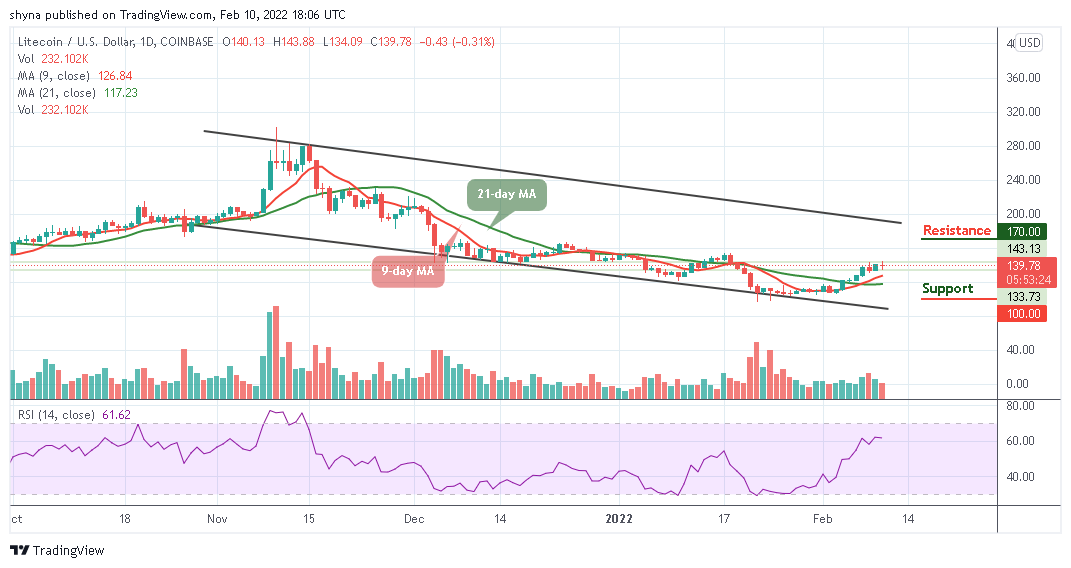
LTC/USD is currently moving towards the negative side as the coin begins to follow the bearish trend. At the time of writing this, the Litecoin price is attempting to cross below the 9-day moving average and once this is done, the coin may hit the nearest support level at $125.
Litecoin Price Prediction: Litecoin (LTC) May Continue in Red
The Litecoin price is yet to recover from the current trading levels, and traders may likely see the Litecoin price fall to a new trading low. A break below the 9-day and 21-day moving averages may provoke a further decline towards the critical supports at $100, $90, and $80. Therefore, the short-term technical analysis shows that the coin may continue the downward movement.
Looking at the daily chart, if the coin decides to change the movement, a break towards the upper boundary of the channel may take Litecoin towards the nearest resistance level of $150 while a further push could take it to a high of $170, $180, and $190 resistance levels. Presently, the technical indicator Relative Strength Index (14) is heading to the south as the signal line nosedives below 60-level, any further negative movement could cause the market to experience another deep fall.

Against Bitcoin, Litecoin (LTC) is moving sideways within the channel, especially in the past few days. The coin remains above the 9-day and 21-day moving averages and may likely fall through subsequent support levels to 3000 SAT. The critical support level is located below the moving averages at 2700 SAT and below.
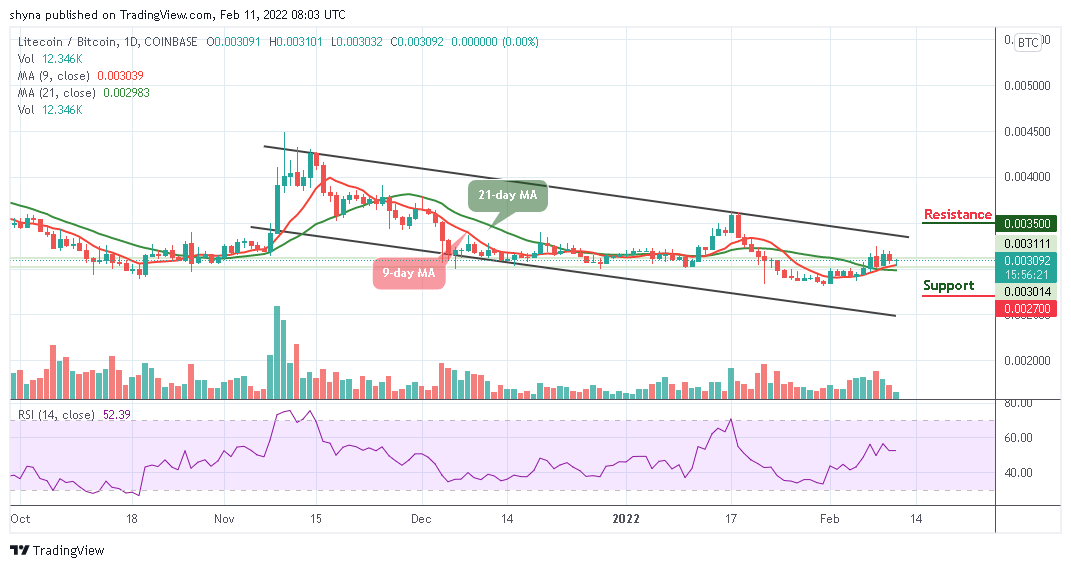
However, if the bulls manage to power the market, traders may find the resistance level at 3500 SAT and above. Meanwhile, the Litecoin price is currently changing hands at 3092 SAT but a surge in volatility may occur as the technical indicator Relative Strength Index (14) may stay above 50-level, meaning that a bullish trend could play out.
Looking to buy or trade Litecoin (LTC) now? Invest at eToro!
68% of retail investor accounts lose money when trading CFDs with this provider
Source link

GIPHY App Key not set. Please check settings