Ethereum (ETH) has become inflationary once again following the reversal of deflationary gains seen in November after the FTX fallout.
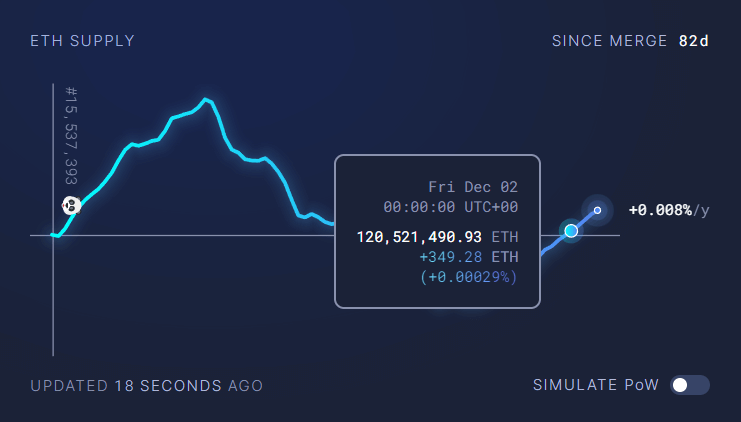
Despite only recently becoming the most deflationary it had ever been, ETH supply reverted back to inflationary on Dec. 2, witnessing a 0.00029% increase —349 ETH — in supply.
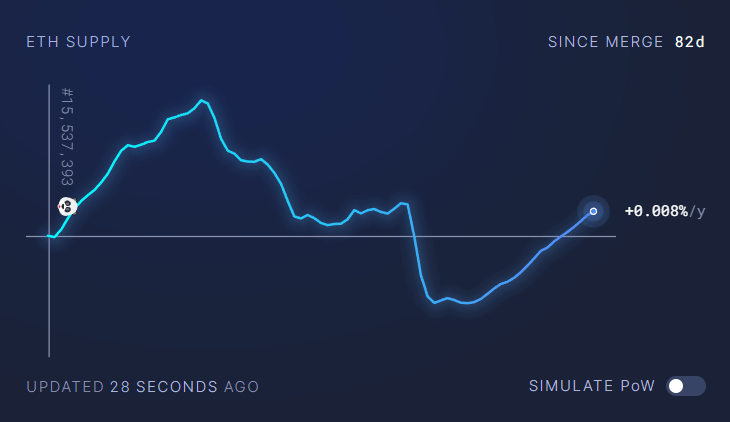
ETH now sits at an inflationary percentage of +0.008% — tracing back close to an inflationary value seen at the beginning of November.
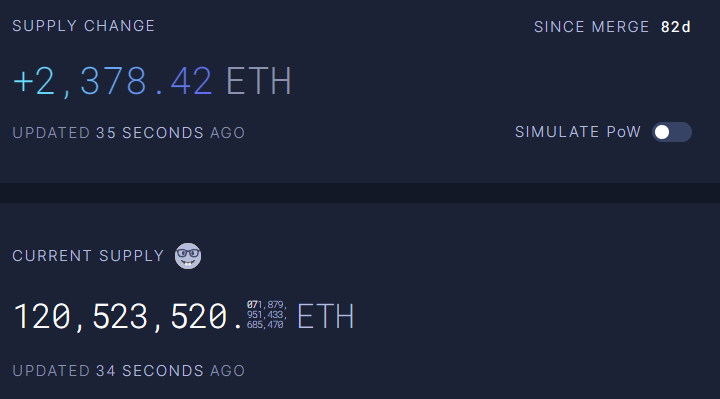
The total ETH supply is now steadily increasing to higher inflationary levels each day — producing an additional 2,300 ETH daily. To top it off, ETH burn rate has continued to fall, adding further suppression to hopes for a switch back to deflationary values.
The deflationary tale of #Ether has come to an end temporally. The annualized inflation rate, which was previously below zero, increased by 0.07% following the #FTX failure. The amount of #ETH burned after FTX’s demise was at 5K+. but now its down to about 1.4k ℹ️@ultrasoundmoney pic.twitter.com/lkcYpPz5F5
— Elite Crypto (@TheEliteCrypto) December 6, 2022

GIPHY App Key not set. Please check settings